

Table of contents
In this analysis, the dataset is taken from the below link.
https://www.kaggle.com/datasets/imdevskp/corona-virus-report
Introduction
This dataset is available with Indian cases only, so the data analysis will show the different states of India and their covid cases.
In this analysis, I will show you how to fetch data from the drive and get the path of your file to perform analysis over it using the pandas Dataframe.
In this analysis, I will be visualizing the data and plotting them for better understanding.
Analysis
# importing neccesary modules
>>> import os
>>> import numpy as np
>>> import pandas as pd
>>> import matplotlib.pyplot as plt
>>> import seaborn as sns

# my data is in G-drive, to access it, we need to mount our drive
>>> from google.colab import drive
>>> drive.mount('/content/drive')

# path of my .csv file
>>> dirname='drive/My Drive/archive/complete.csv'
>>> pip install geopandas
# geopandas library makes us enable to work with geospatial data

>>> import geopandas as gpd
>>> from shapely.geometry import Point, polygon
>>> import descartes
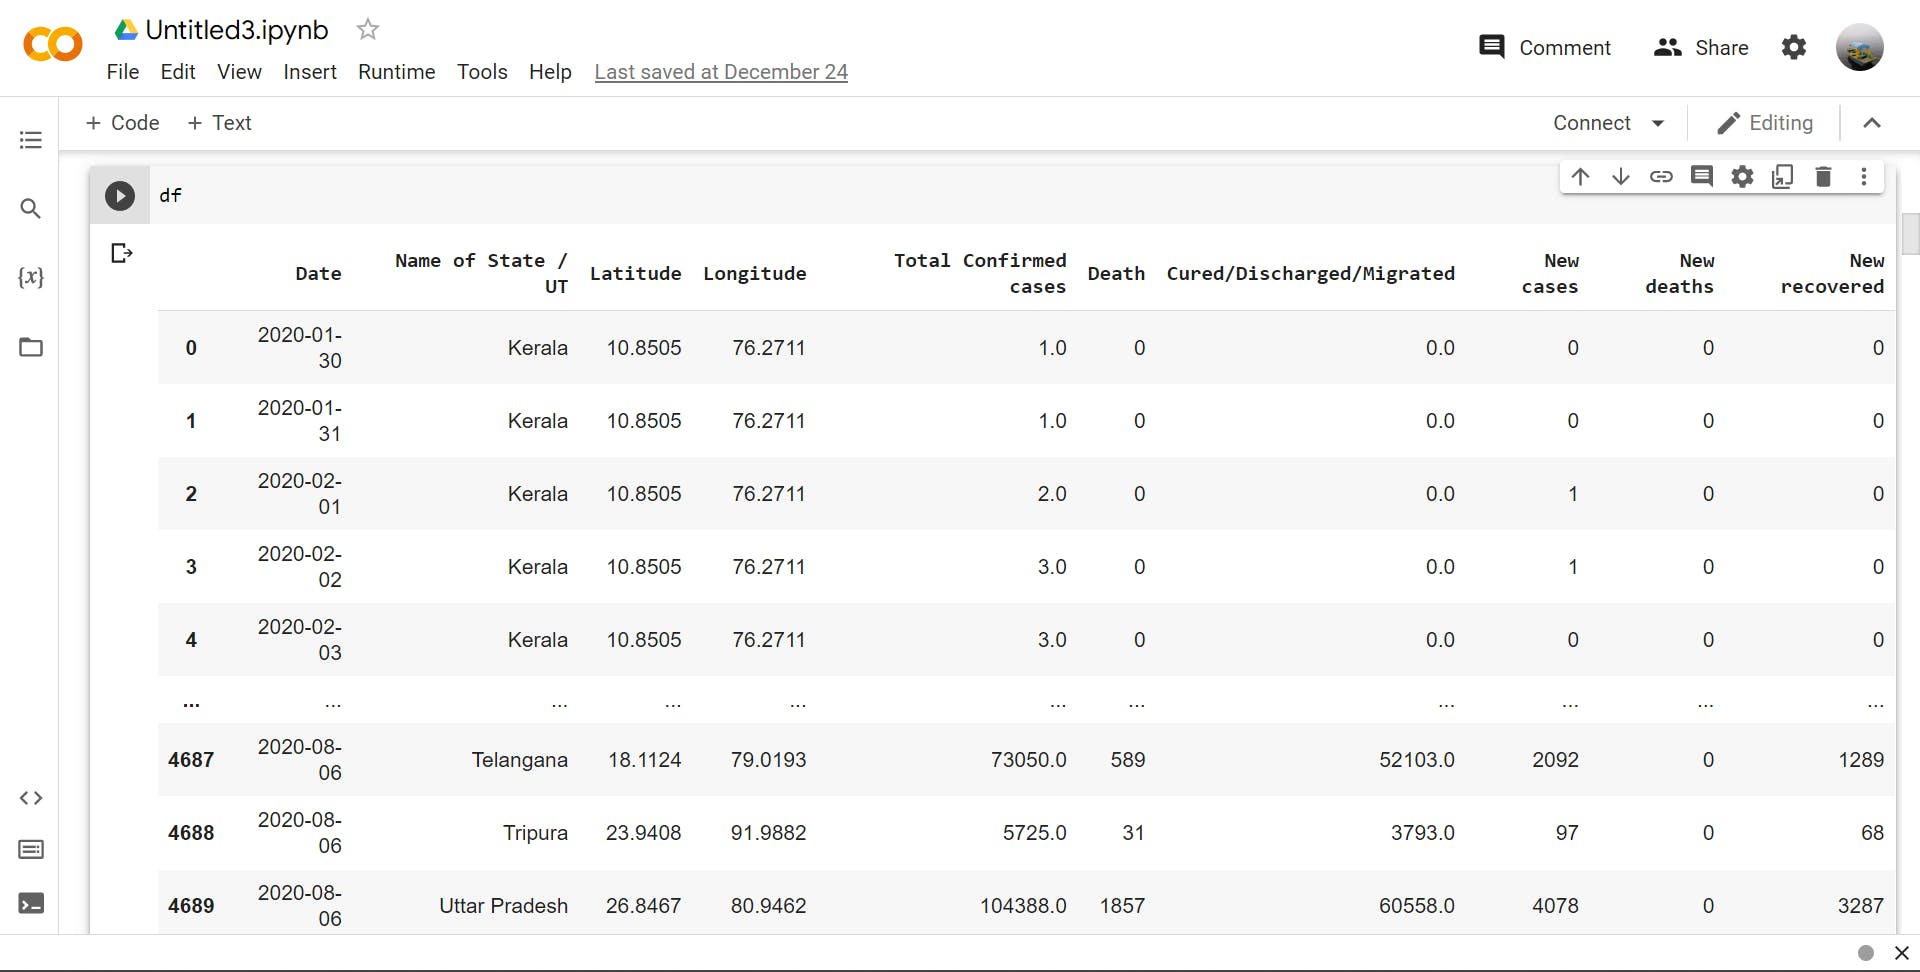
>>> df = pd.read_csv(dirname)

Output is shown below:-
>>> df.columns

Output :-
df.columns
Index(['Date', 'Name of State / UT', 'Latitude', 'Longitude',
       'Total Confirmed cases', 'Death', 'Cured/Discharged/Migrated',
       'New cases', 'New deaths', 'New recovered'],
      dtype='object')
# to change the names of columns
>>> df = df.rename(columns={'Name of State / UT':'State','Cured/Discharged/Migrated':'Discharged','Total Confirmed cases':'conf_cases' })

Output :-
Index(['Date', 'State', 'Latitude', 'Longitude',
       'conf_cases', 'Death', 'Discharged',
       'New cases', 'New deaths', 'New recovered'],
      dtype='object')
>>> df.shape

Output :- (4692, 10)
>>> df.dtypes

Output :-
Date              object
State             object
Latitude         float64
Longitude        float64
conf_cases       float64
Death             object
Discharged       float64
New cases          int64
New deaths         int64
New recovered      int64
dtype: object
# to check total nan values in each columns
>>> df.isna().sum()

Output :-
Date             0
State            0
Latitude         0
Longitude        0
conf_cases       0
Death            0
Discharged       0
New cases        0
New deaths       0
New recovered    0
dtype: int64
>>> df.head(5).describe
#describe method is used to view a descriptive statistic
>>> df.groupby('Date')['conf_cases','Death','Discharged','New cases','New deaths'].sum().tail(10)
# this command will fetch bottom 10 rows/data of 5 columns specified in list, grouped by Date column with sum of all data present in them.

Output :-


  Date      conf_cases Death Discharged New cases New deaths
2020-07-28    383723.0    89    221944.0    7924    0
2020-07-29    391440.0    89    232277.0    7948    0
2020-07-30    400651.0    98    239755.0    10093    0
2020-07-31    411798.0    94    248615.0    11147    0
2020-08-01    422118.0    98    256158.0    10376    0
2020-08-02    431719.0    876    266883.0    9601    0
2020-08-03    441228.0    886    276809.0    9509    0
2020-08-04    450196.0    900    287030.0    8968    0
2020-08-05    457956.0    95    299356.0    9747    0
2020-08-06    468265.0    98    305521.0    10309    0
>>> df.groupby('State')['conf_cases','Discharged','New cases','New deaths'].max().head(10) #using head to shorten the output
# sum of all data present in specified columns, in above command will be fetched grouped by State (only 10 rows/data)

Output :-
    conf_cases    Discharged    New cases    New deaths
State
Andaman and Nicobar Islands    1027.0    326.0    99    0
Andhra Pradesh    186461.0    104354.0    10376    0
Arunachal Pradesh    1855.0    1210.0    147    0
Assam    50445.0    35892.0    2886    0
Bihar    64770.0    42414.0    3007    0
Chandigarh    1270.0    715.0    64    0
Chhattisgarh    10407.0    7871.0    512    0
Dadra and Nagar Haveli and Daman and Diu    1366.0    960.0    108    0
Delhi    140232.0    126116.0    6850    0
Goa    7423.0    5287.0    353    0
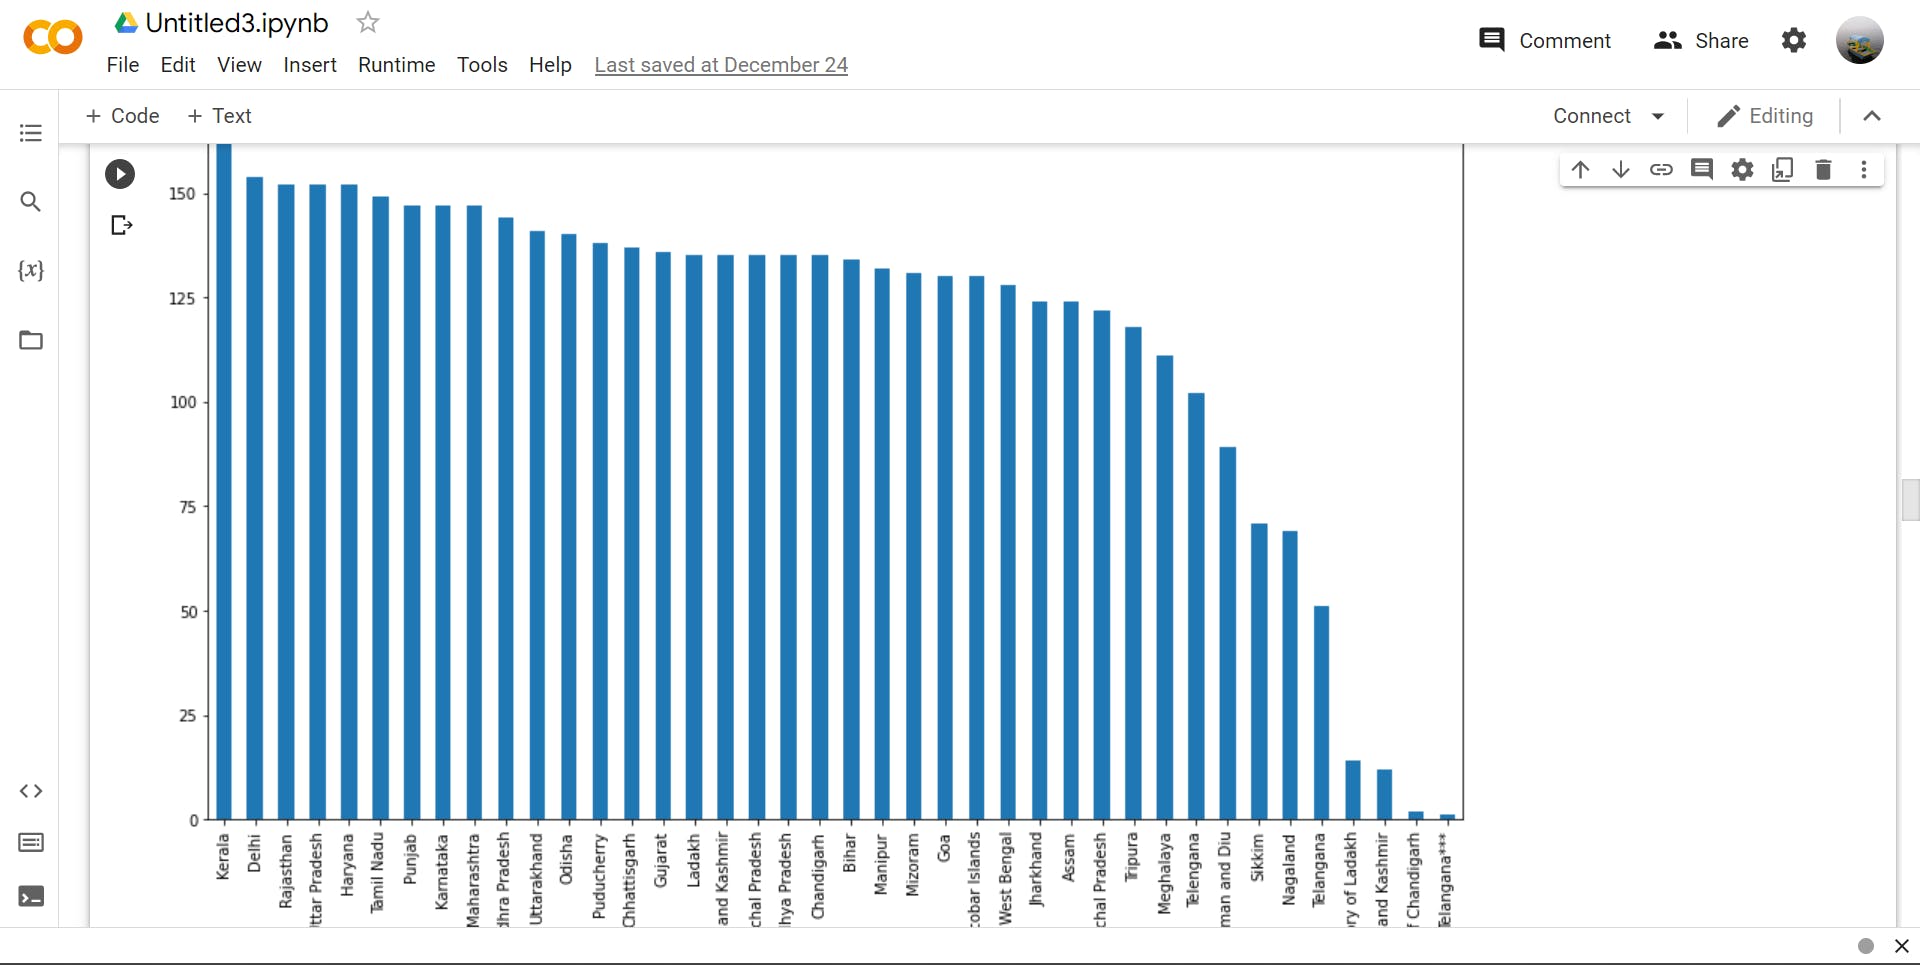
>>> df['State'].value_counts().head(5)  #using head to shorten the output
#this return a Series containing counts of unique rows in the DataFrame(5 rows only)

Output :-
Kerala                                      186
Delhi                                       154
Rajasthan                                   152
Uttar Pradesh                               152
Haryana                                     152
Tamil Nadu                                  149
>>> df['State'].value_counts().plot(kind='bar',figsize=(15,10))
>>> gdf01 = gpd.GeoDataFrame(df,geometry=gpd.points_from_xy(df['Latitude'],df['Longitude']))
>>> gdf01.head()
# using geopandas to Generate GeometryArray of shapely Point geometries from x, y(, z) coordinates.

Ouput :-
    Date    State    Latitude    Longitude    conf_cases    Death    Discharged    New cases    New deaths    New recovered    geometry
0    2020-01-30    Kerala    10.8505    76.2711    1.0    0    0.0    0    0    0    POINT (10.85050 76.27110)
1    2020-01-31    Kerala    10.8505    76.2711    1.0    0    0.0    0    0    0    POINT (10.85050 76.27110)
2    2020-02-01    Kerala    10.8505    76.2711    2.0    0    0.0    1    0    0    POINT (10.85050 76.27110)
3    2020-02-02    Kerala    10.8505    76.2711    3.0    0    0.0    1    0    0    POINT (10.85050 76.27110)
4    2020-02-03    Kerala    10.8505    76.2711    3.0    0    0.0    0    0    0    POINT (10.85050 76.27110)
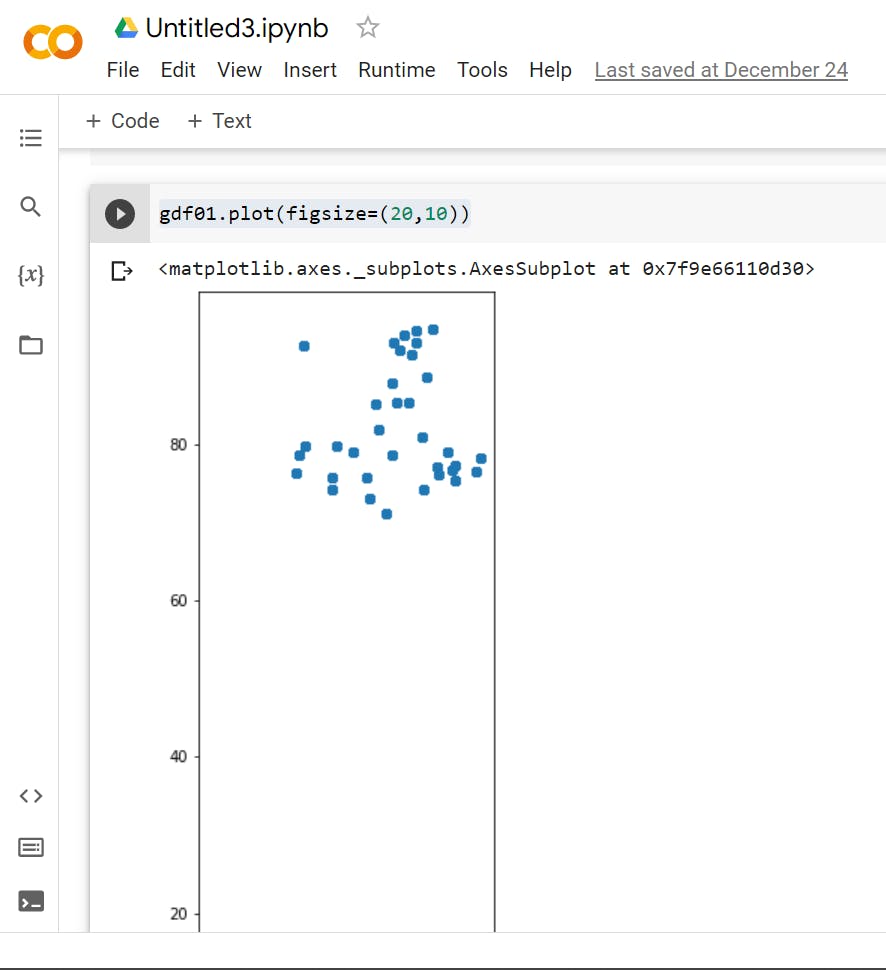
>>> gdf01.plot(figsize=(20,10))
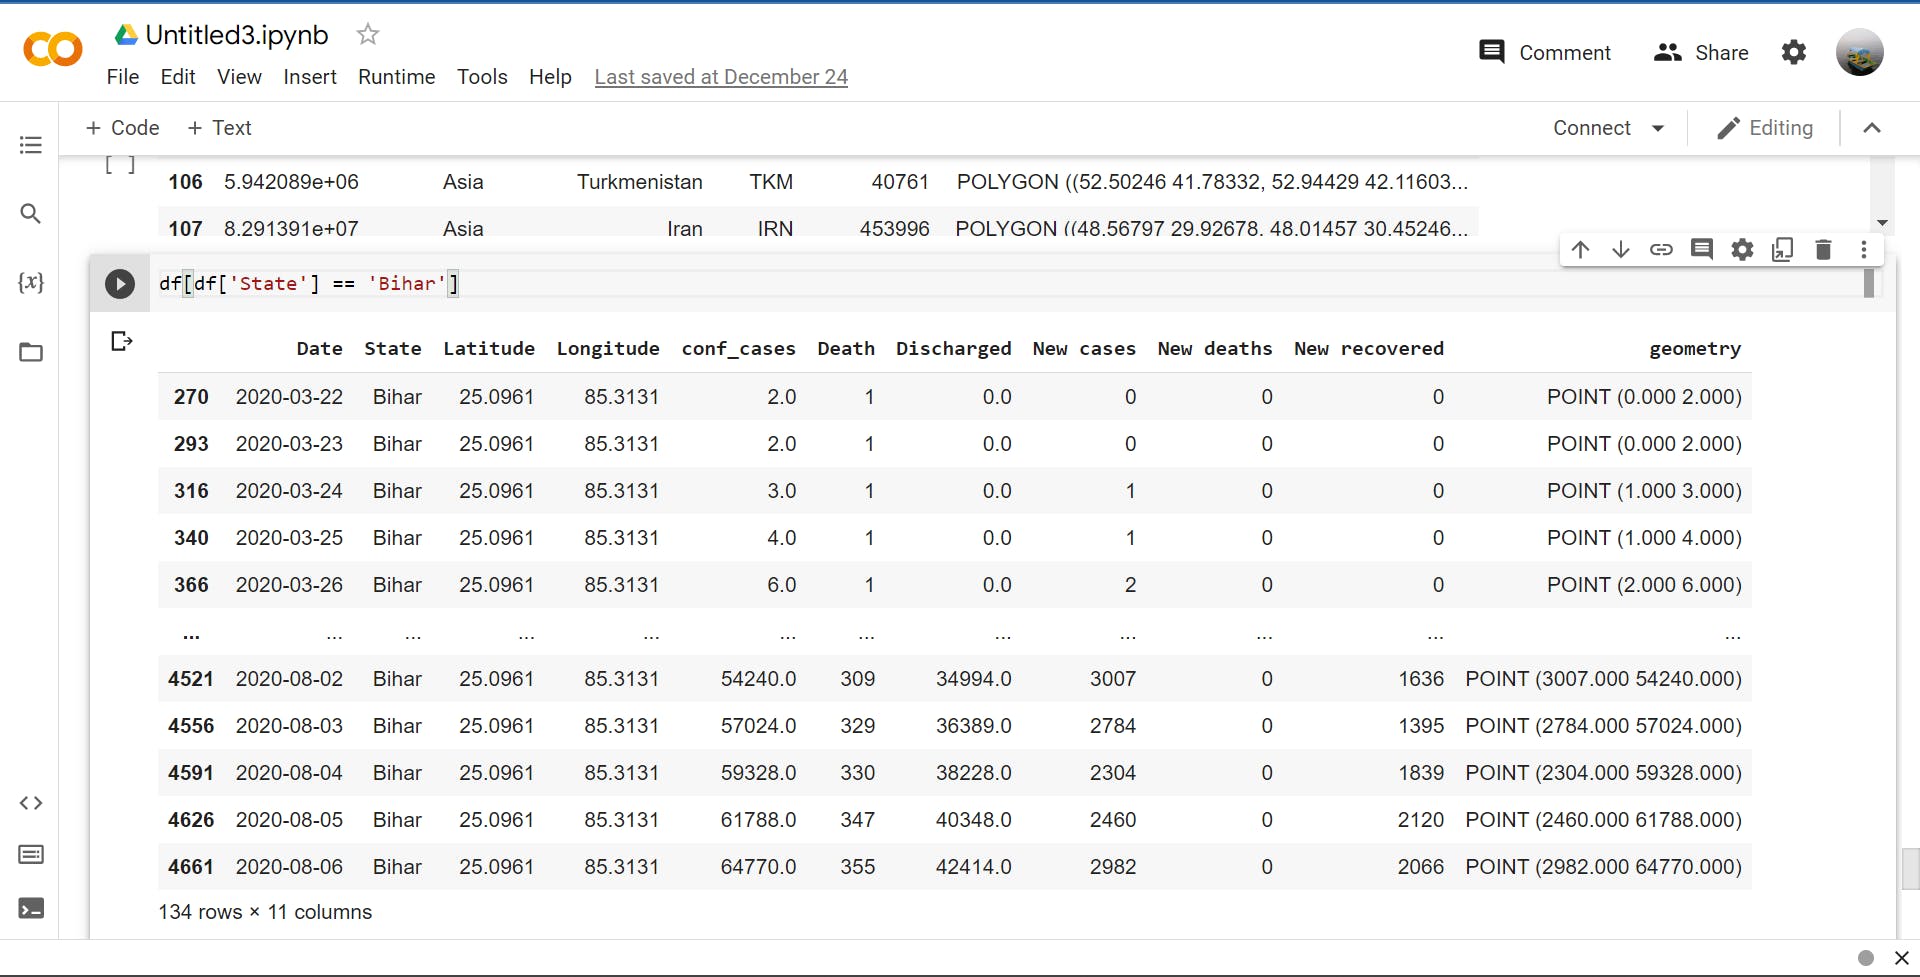
>>> df[df['State'] == 'Bihar']
# collect and show all data where state = bihar