Data Engineering with GitHub Repos
fetching repo with highest stars, forks and language used, visualizing through Looker.
Table of contents
PermalinkIntroduction
In this blog, I am going to show you how to fetch all repositories that have more stars, put them in BigQuery and visualize that through Looker(Google Data Studio).
I will be fetching the repo description, number of times it forked, the language used and the date of creation.
PermalinkPre-requisite
You should have a GCP account, with a service account(recommended).
A Looker account is a must that will be used to Visualize the data.
PermalinkProcedure & Code
Import all necessary Libraries
 >>> import requests
 >>> from datetime import datetime
 >>> from google.cloud import bigquery
 >>> from google.oauth2 import service_account
 >>> from google.oauth2.credentials import Credentials
Make an API request to fetch the top 200 repositories with the highest stars.
>>> response = requests.get('https://api.github.com/search/repositories?q=stars:>0&sort=stars&per_page=200')Traverse through every repository and take out needed attributes/data.
 # Convert the response data to JSON format
 >>> data = response.json()

 # Create a list to store the repository data
 >>> repos_data = []

 # Loop through each repository in the response data
 >>> for repo in data['items']:
     # Extract the repository data/attribute we want
     name = repo['name']
     description = repo['description']
     stars = repo['stargazers_count']
     forks = repo['forks_count']
     language = repo['language']
     created_date = datetime.strptime(repo['created_at'], '%Y-%m-%dT%H:%M:%SZ').date()

     # Add the repository data to the list
     repos_data.append((name, description, stars, forks, language, created_date))
Initialize the BigQuery client and insert the data after making the table.
 # Define the BigQuery table schema
 >>> schema = [
     bigquery.SchemaField('name', 'STRING'),
     bigquery.SchemaField('description', 'STRING'),
     bigquery.SchemaField('stars', 'INTEGER'),
     bigquery.SchemaField('forks', 'INTEGER'),
     bigquery.SchemaField('language', 'STRING'),
     bigquery.SchemaField('created_date', 'DATE')
     ]

 # Define the BigQuery table reference
 >>> table_ref = client.dataset('dataset-id').table('table_id')

 # Create the BigQuery table if it doesn't exist
 >>> try:
       client.get_table(table_ref)
     except:
       client.create_table(bigquery.Table(table_ref, schema=schema))

 # Insert the repository data into the BigQuery table
 >>> table = client.get_table(table_ref)
 >>> rows_to_insert = [list(repo_data[0:5]) + [repo_data[5].strftime('%Y-%m-%d')] for repo_data in repos_data]
 >>> errors = client.insert_rows(table, rows_to_insert)

 >>> if errors == []:
       print('Data inserted into BigQuery successfully!')
     else:
       print(f'Errors occurred while inserting data into BigQuery: {errors}')
PermalinkVisualization
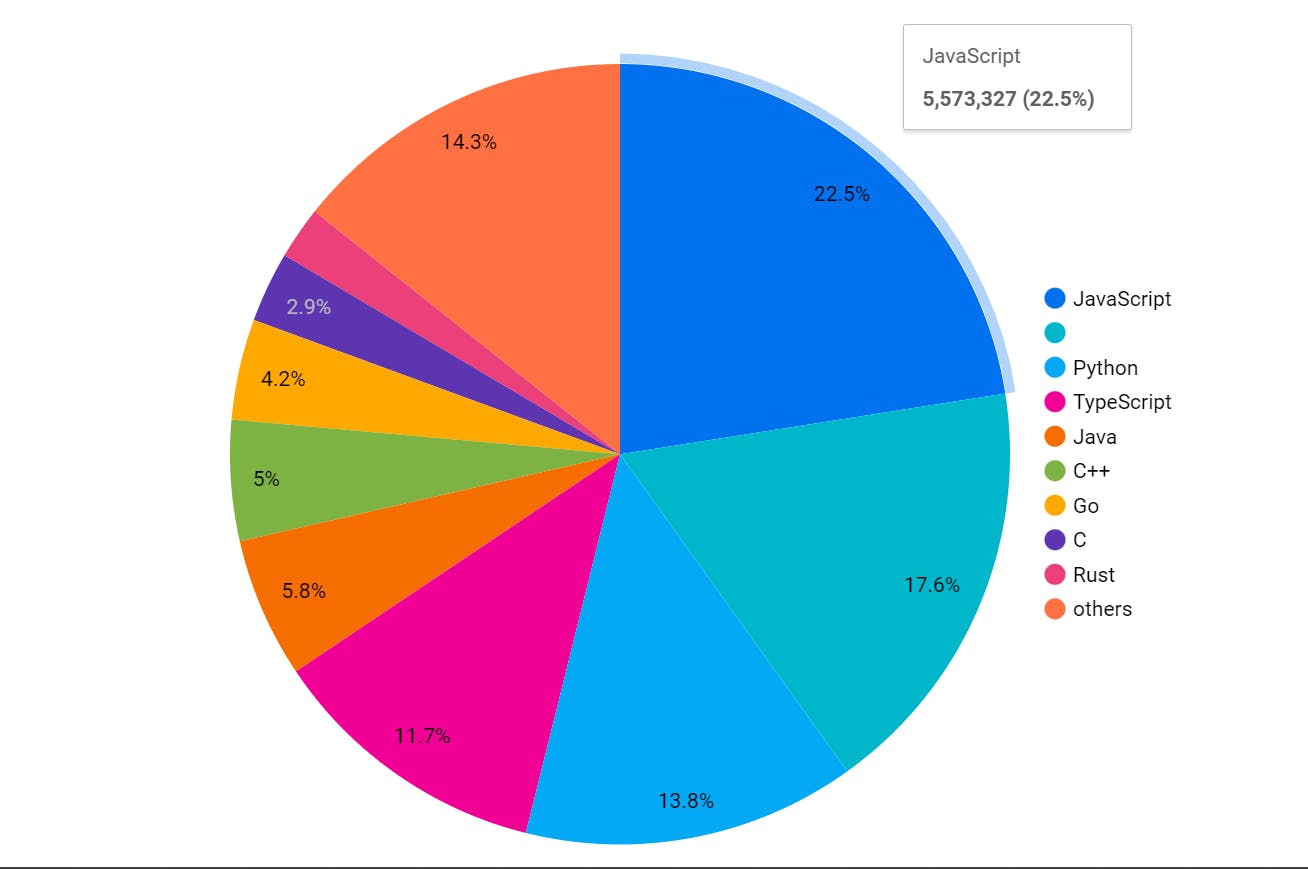
I'm using looker to visualize the data because it is easy to connect BigQuery data with Looker.

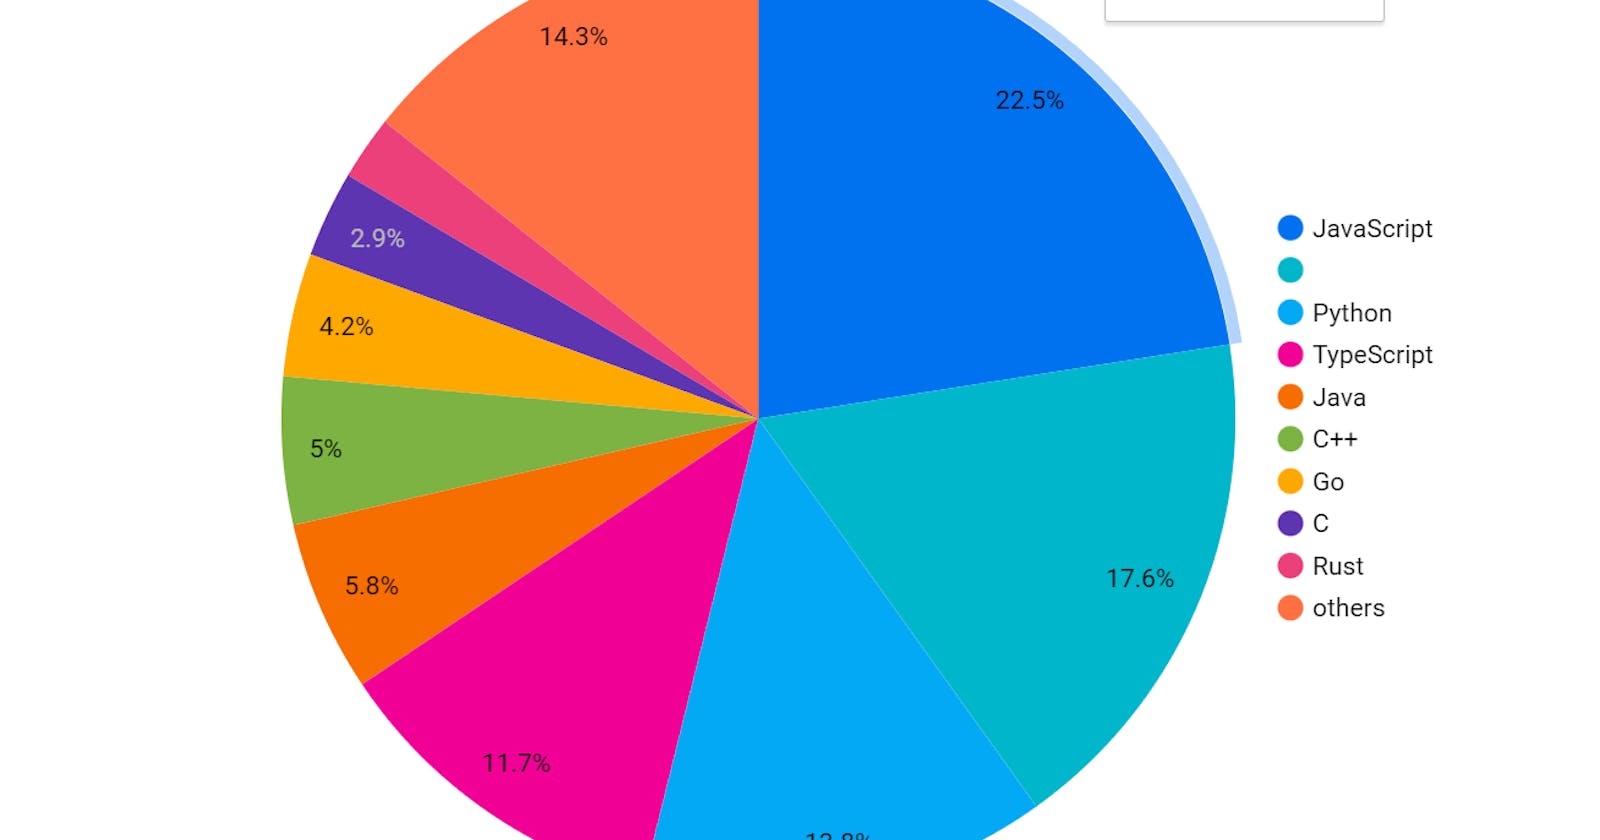
my language columns have a 'null' value at some records, which is shown in the 2nd color from the top (without any name), but you can use a SQL command to replace that null with xyz (or any name) with the below command in your table so that can appear in the pie chart with name(xyz).
UPDATE `project.dataset.table`
SET language = 'xyz'
WHERE language IS NULL
-- above language is column name
PermalinkConclusion
Through the above, you can fetch the data from GitHub, and visualize them with Looker or any other tool. You can fetch any other data also from Github as per your need and can use Looker in a more informative way.
